Find the edge across 20+ markets.
Two fair prices for every market: no-vig consensus across 20+ markets, and our own projections. Take the biggest edge. No touts, no guesswork.
Everything you need to price a market, in one app
Six surfaces, one data spine. Every number is pulled live, stamped with its source, and devigged the same way. Here is what each one looks like.
Every market, devigged, ranked by edge
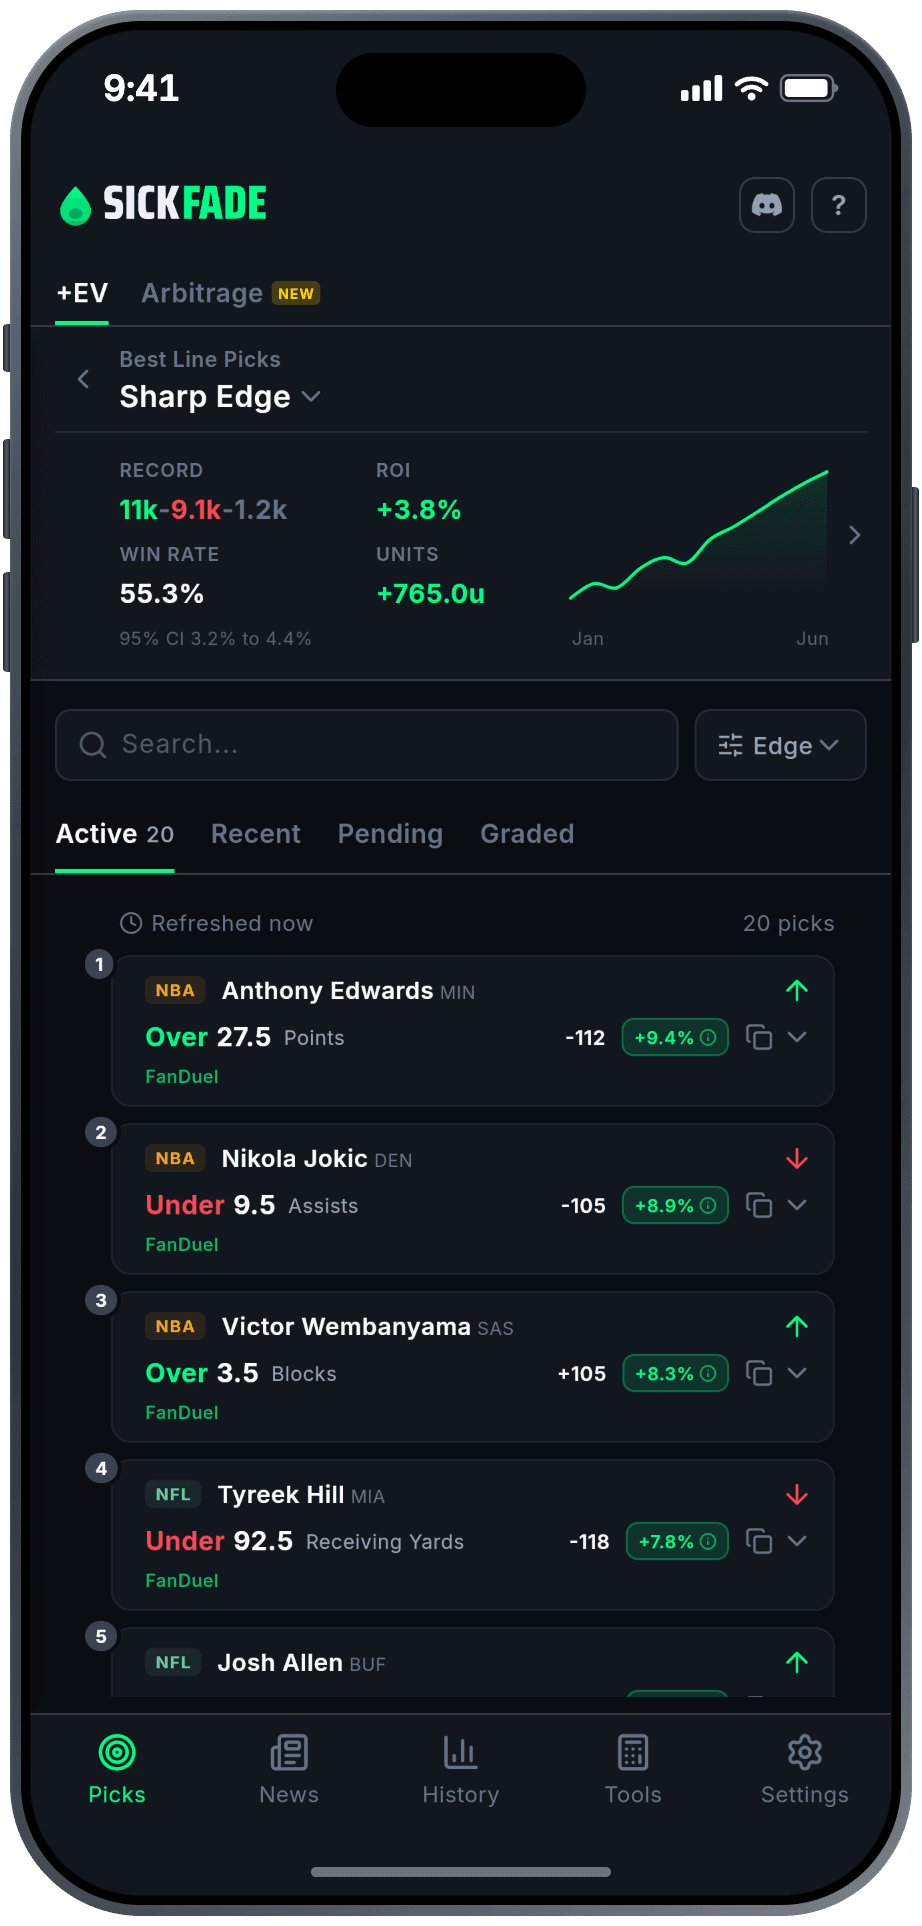
Open a channel and see the day’s projections sorted by no-vig edge. Each row carries the best market, the price, and the edge against fair. Filter by sport, search a player, set a minimum edge.
- Channels for each source: DraftKings, Sharp Edge, and Sharp Edge+ (our sharpest reference prices).
- Best-price column points you at the market to actually play.
- NBA, NFL, MLB, NHL, WNBA, CBB.
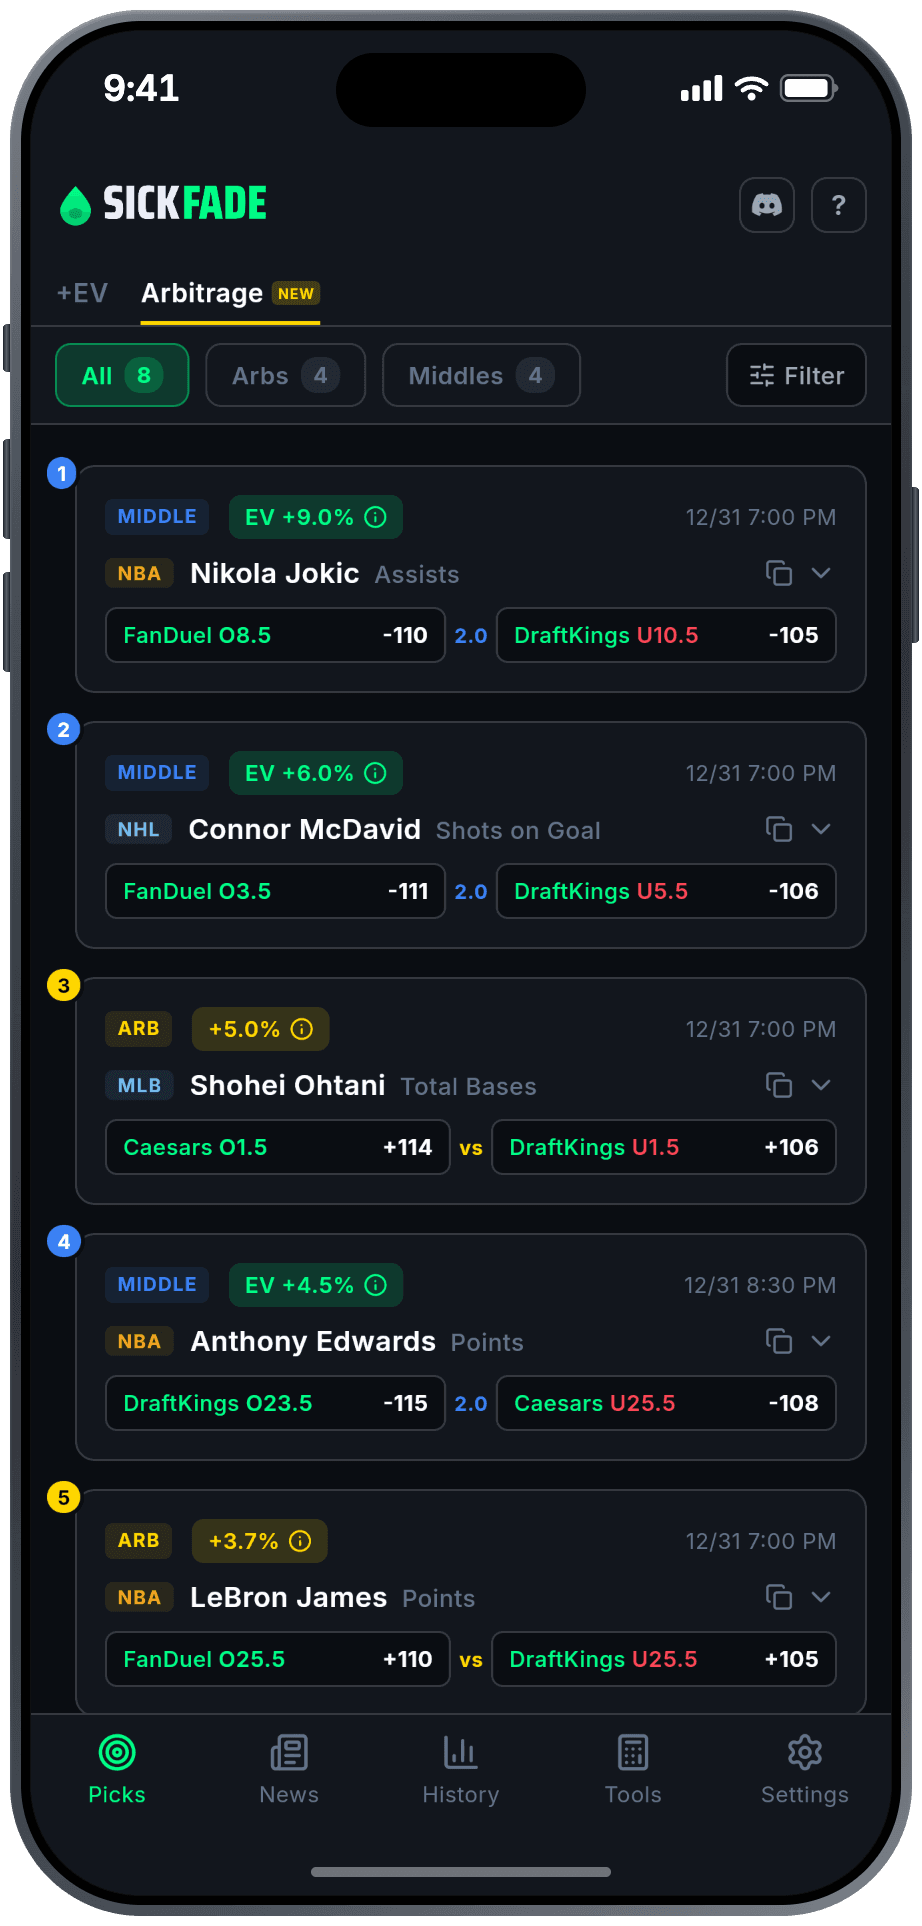
Two-sided edges and middle windows, found for you
When two markets disagree enough, both sides clear a profit (arb) or open a window where both can hit (middle). SickFade flags them with the EV and the exact picks, so you just place two entries.
- Arb: both picks across two markets, locked return shown.
- Middle: the gap between prices, with the numbers that cash both.
- Filter to Arbs or Middles, sorted by EV.
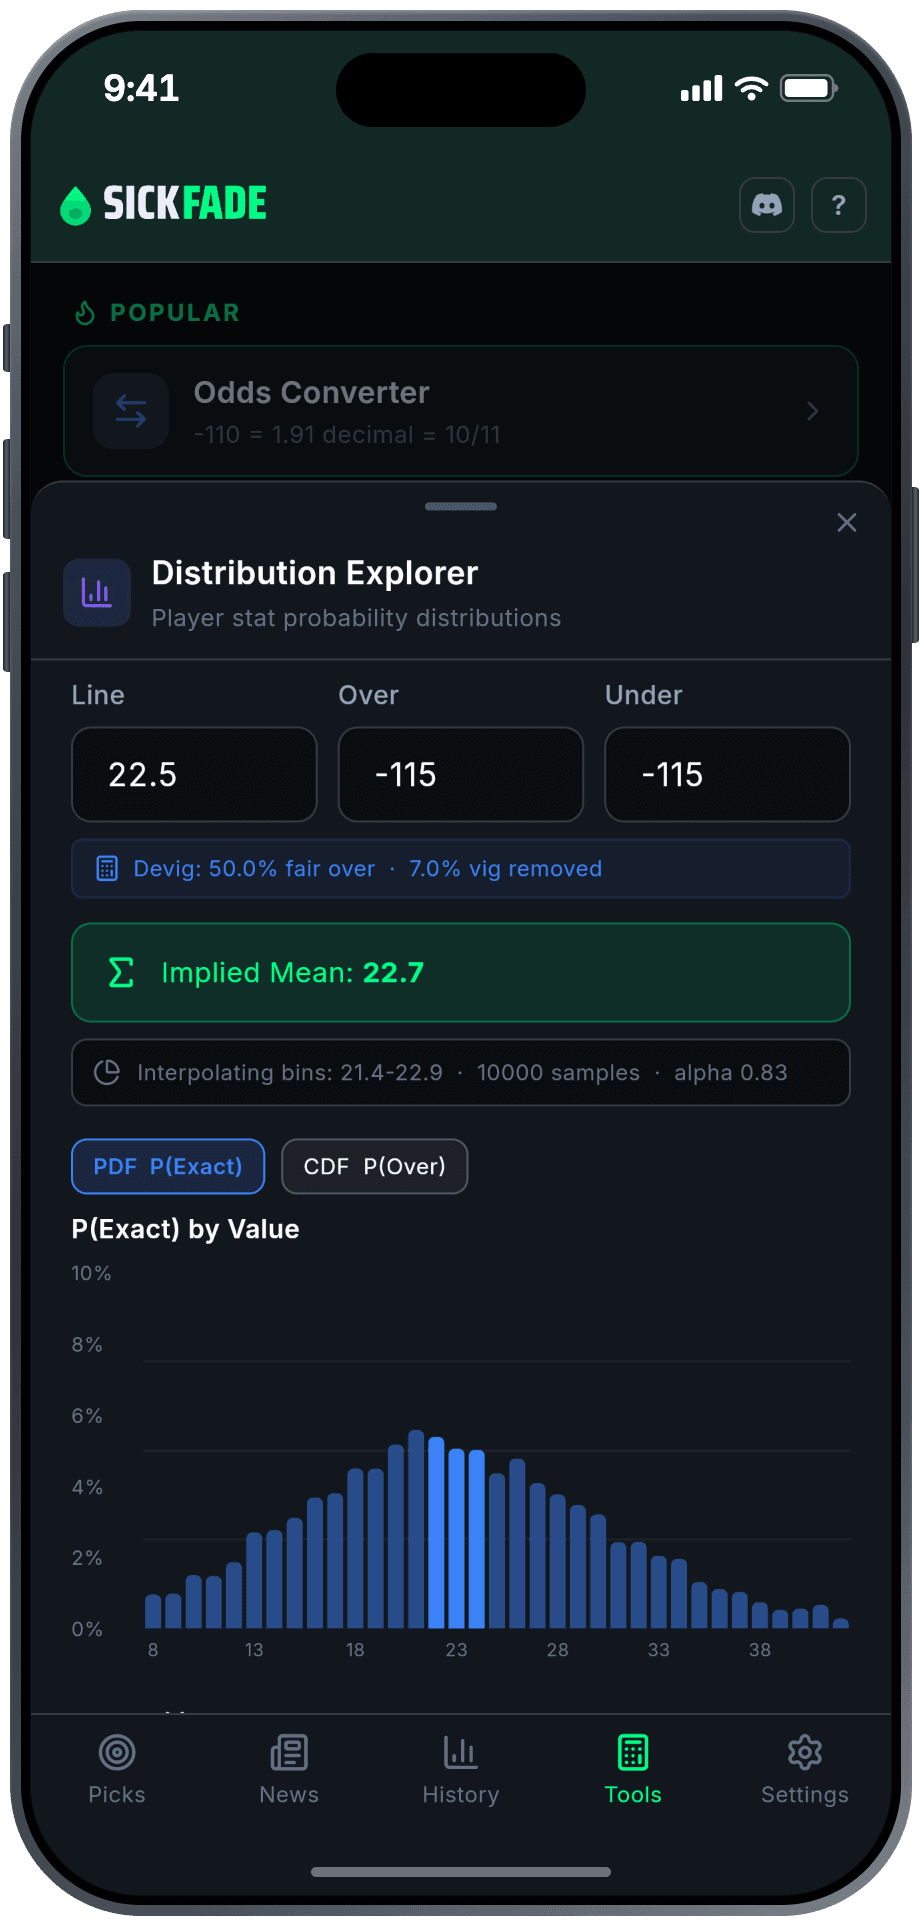
Type a number, get the fair price and the full distribution
Enter any number and the two prices. SickFade strips the vig, returns the fair probability and the implied mean, and plots the whole P(Higher) and P(Lower) curve so you can price alt numbers off one input.
- Devig math shown: fair higher %, vig removed, implied mean.
- 10,000-sample interpolation, PDF and CDF views.
- Probability table across every alt number.
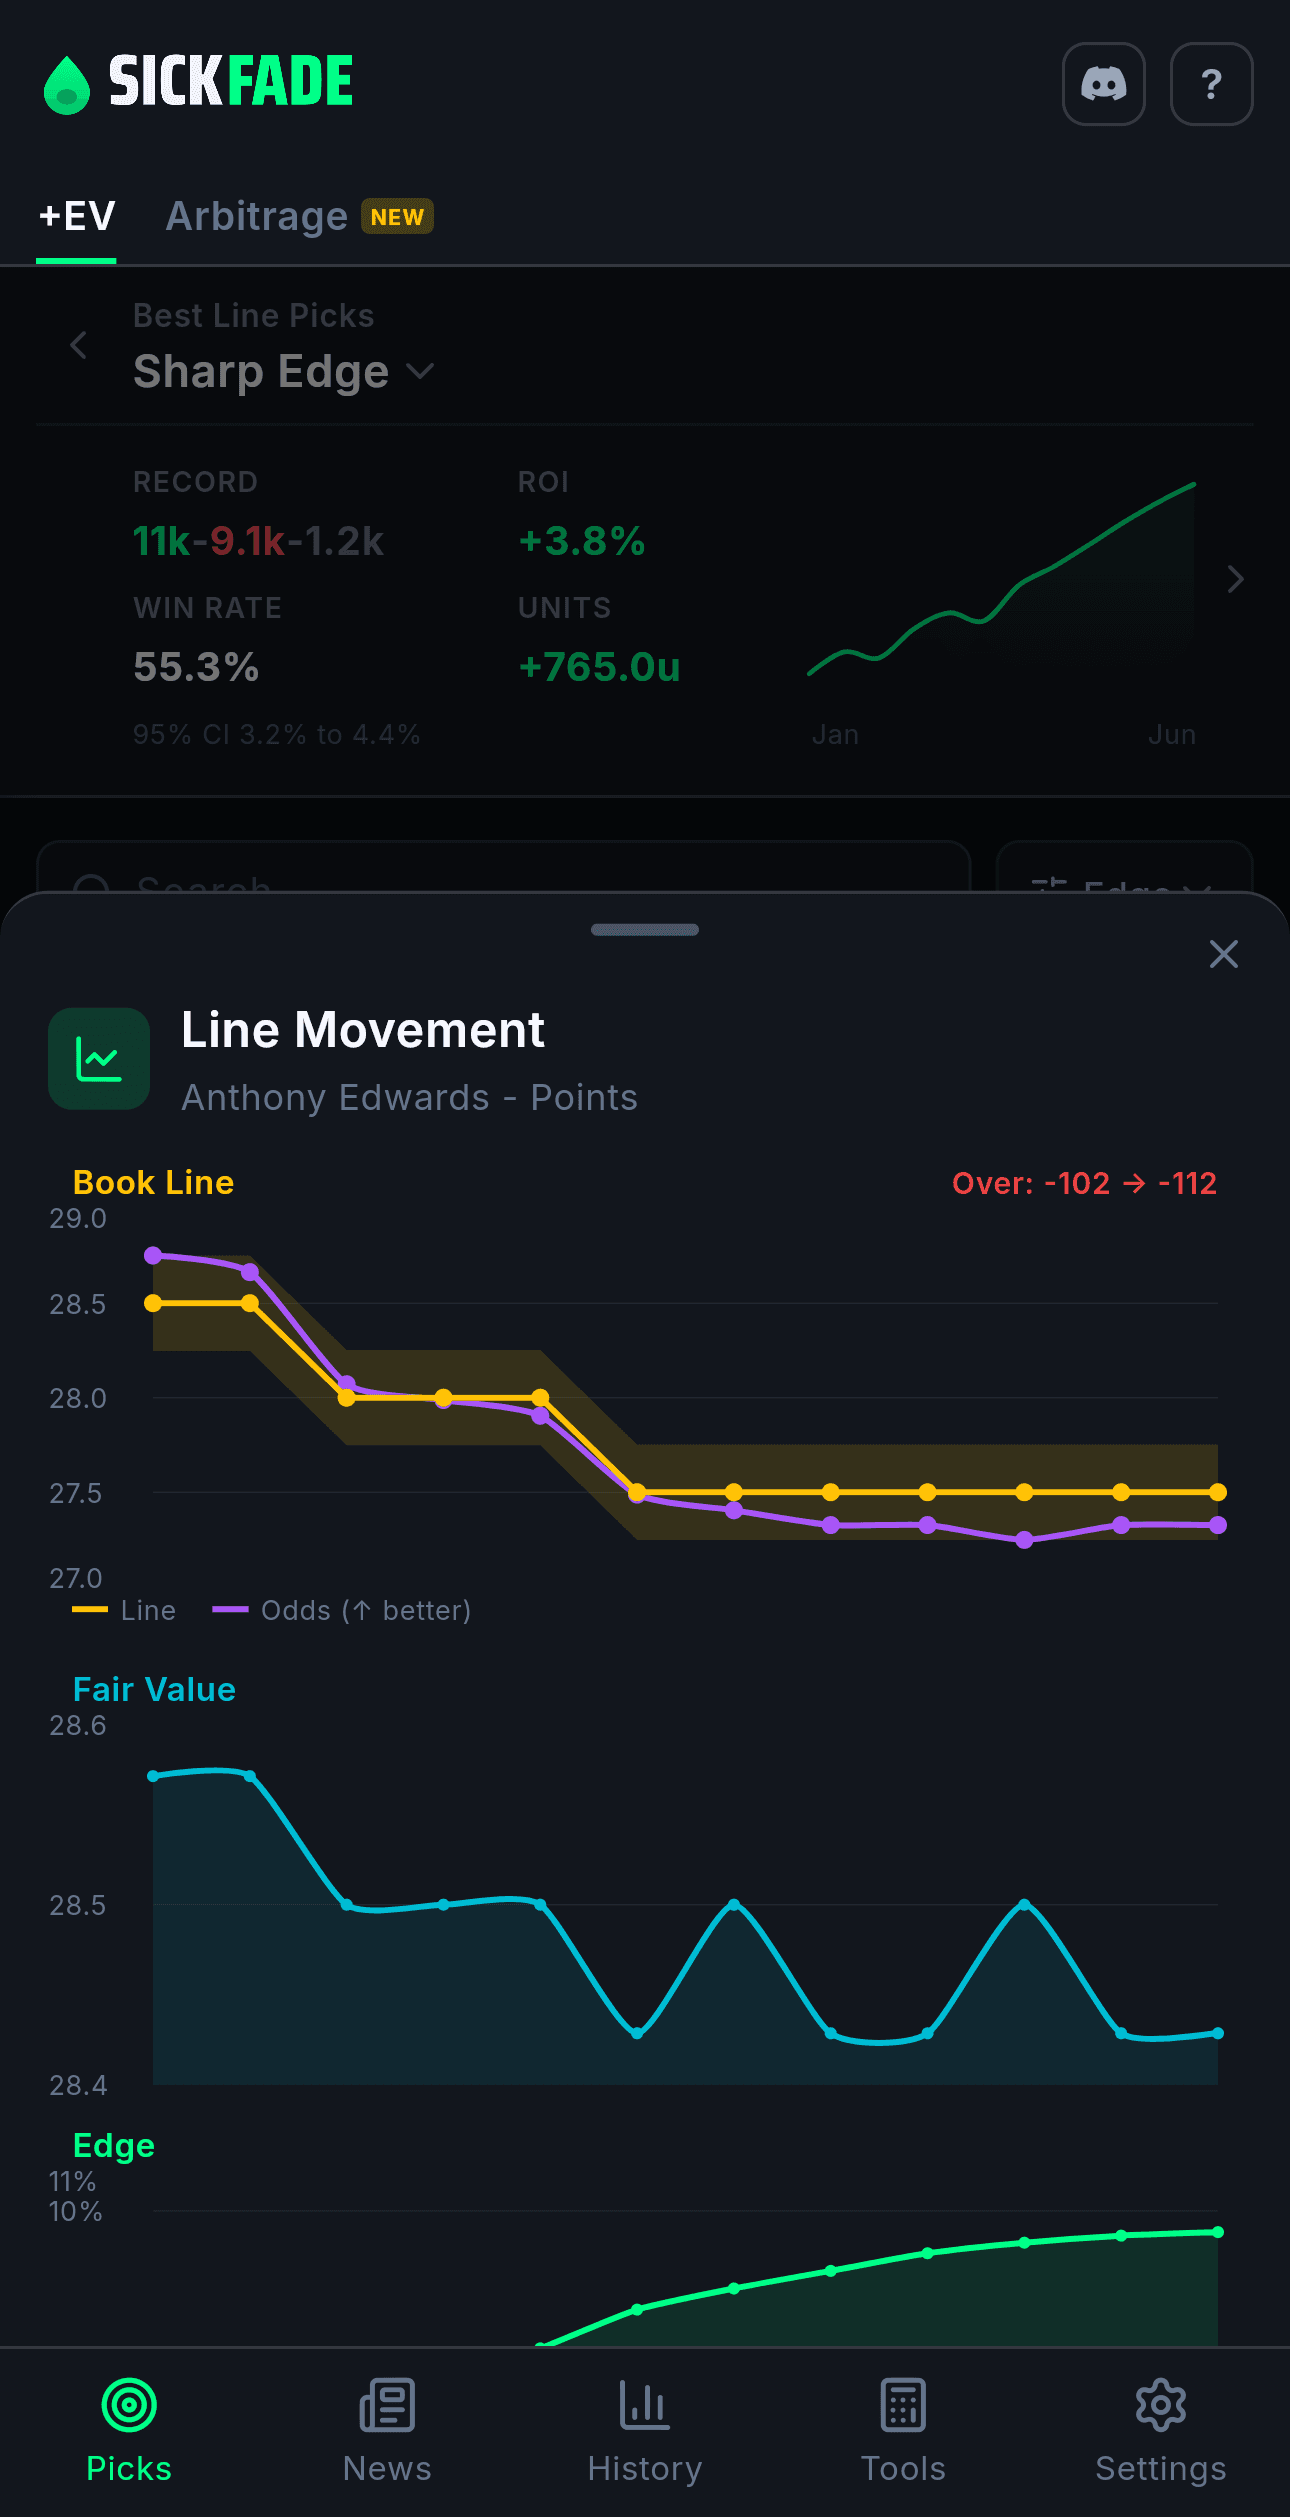
Watch the market move to your price
Open-to-close movement on any market, with the point SickFade flagged it marked. When the market comes to your number, that is closing-line value you can see.
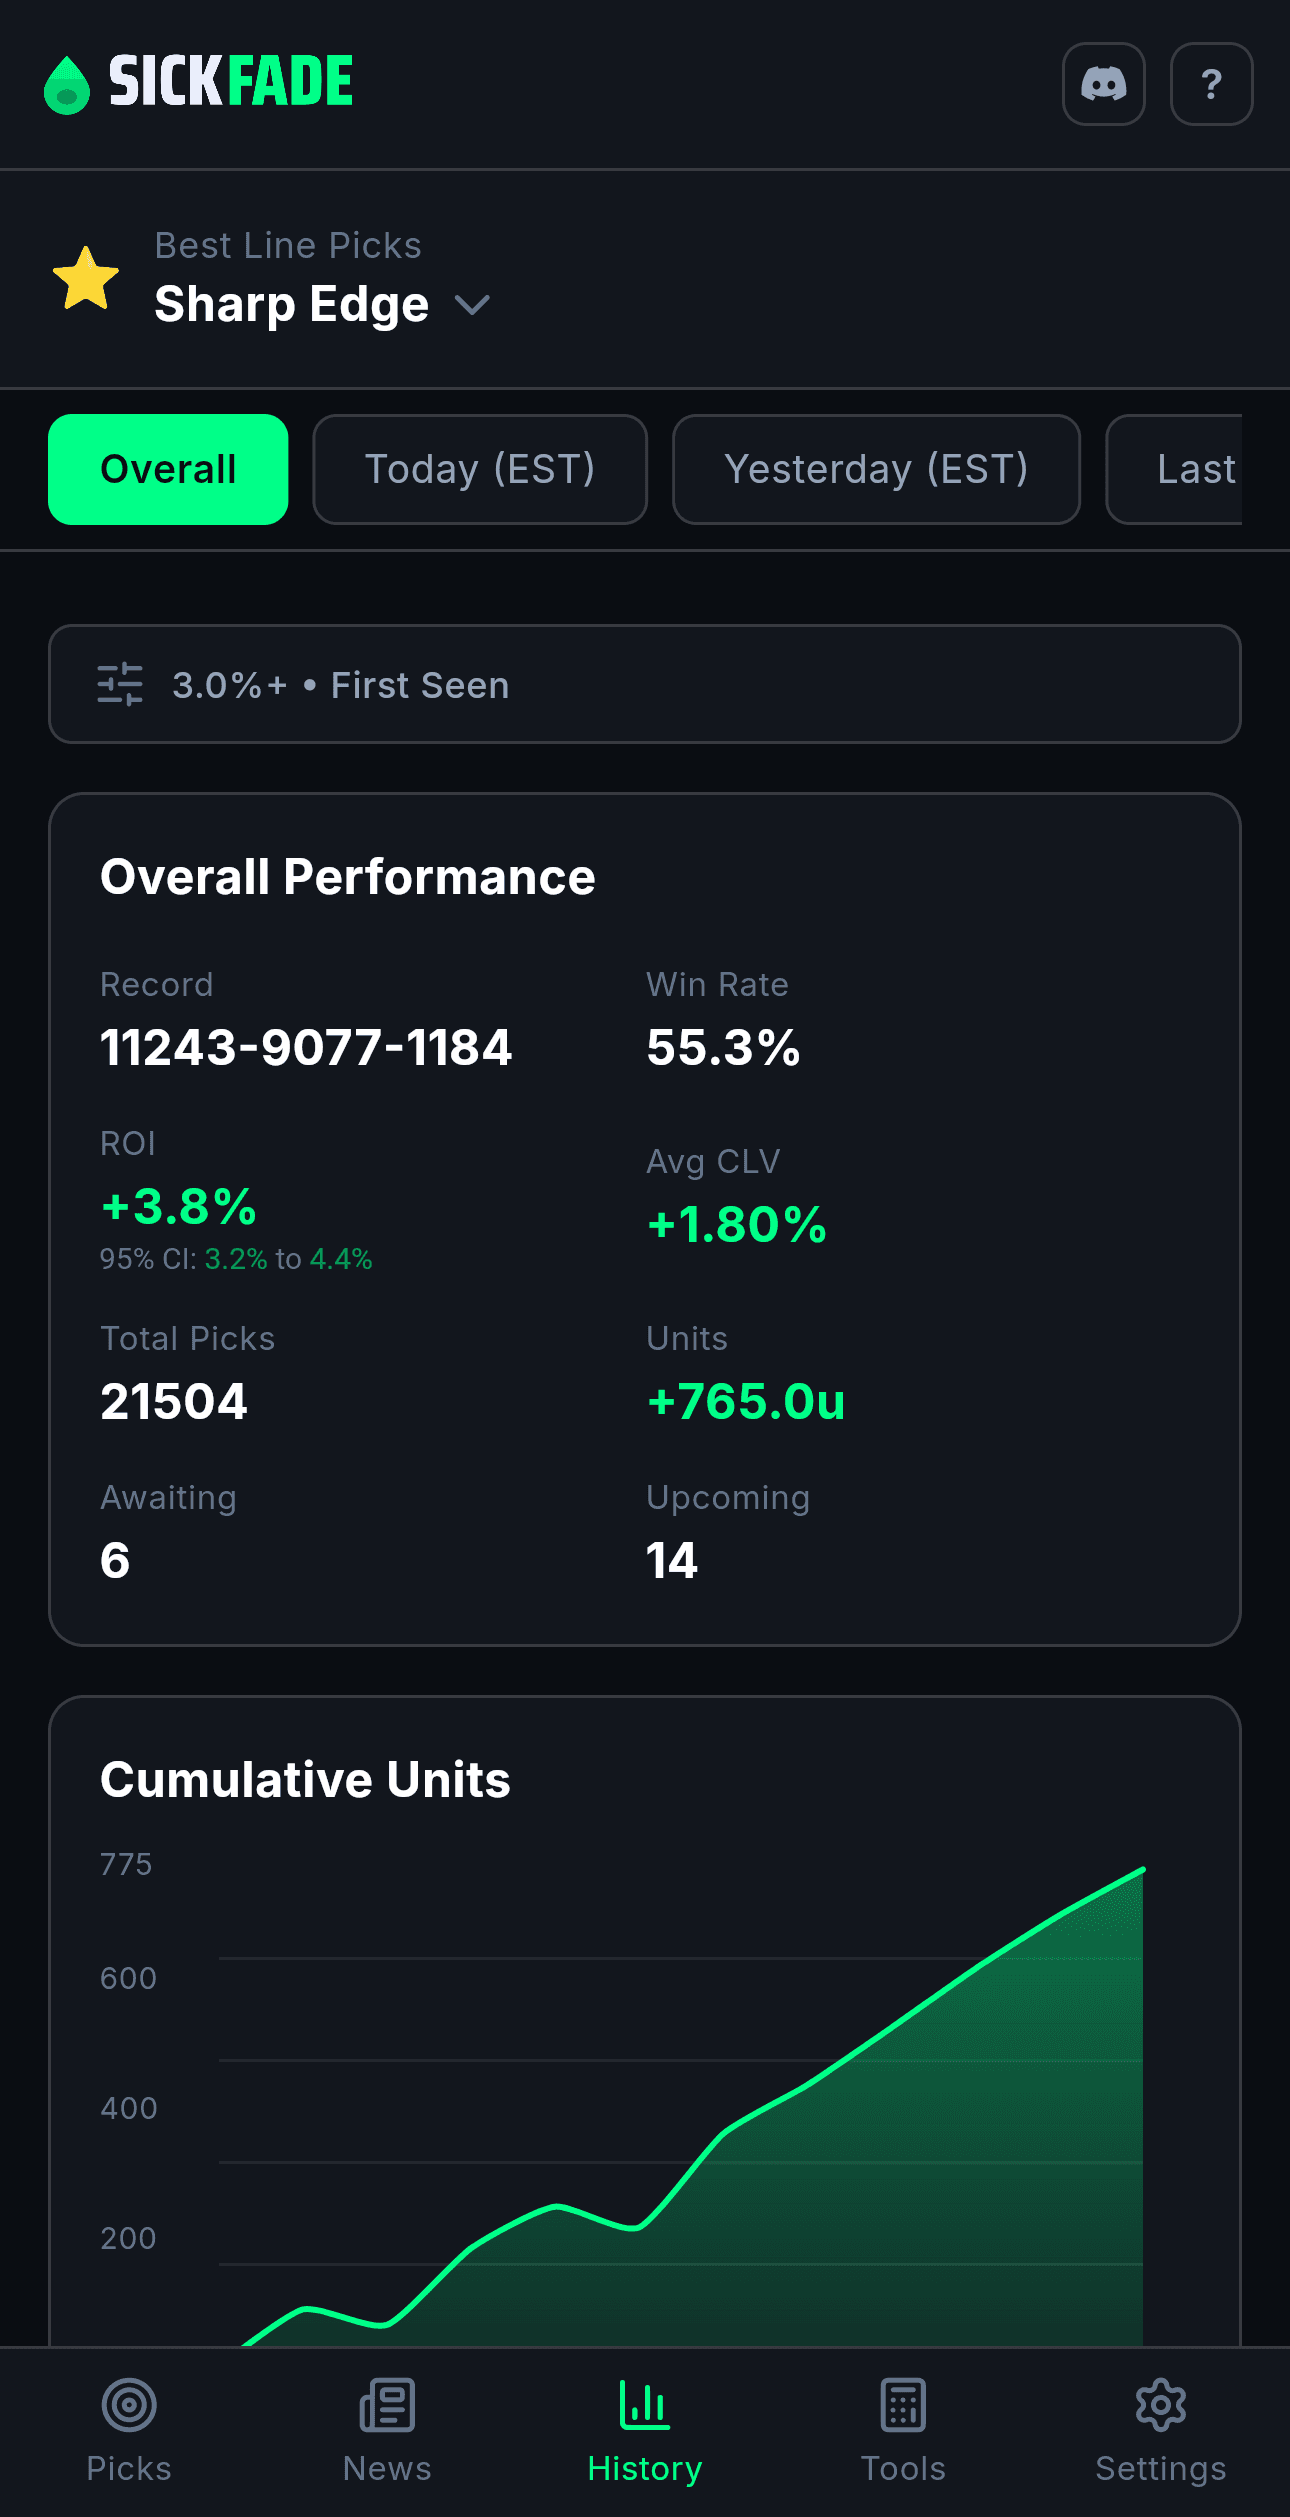
Every graded pick, win or loss
The full history with closing-line value on each pick. Filter by sport, market, edge range, or player. Nothing deleted, nothing cherry-picked.
Size plays, not fantasies
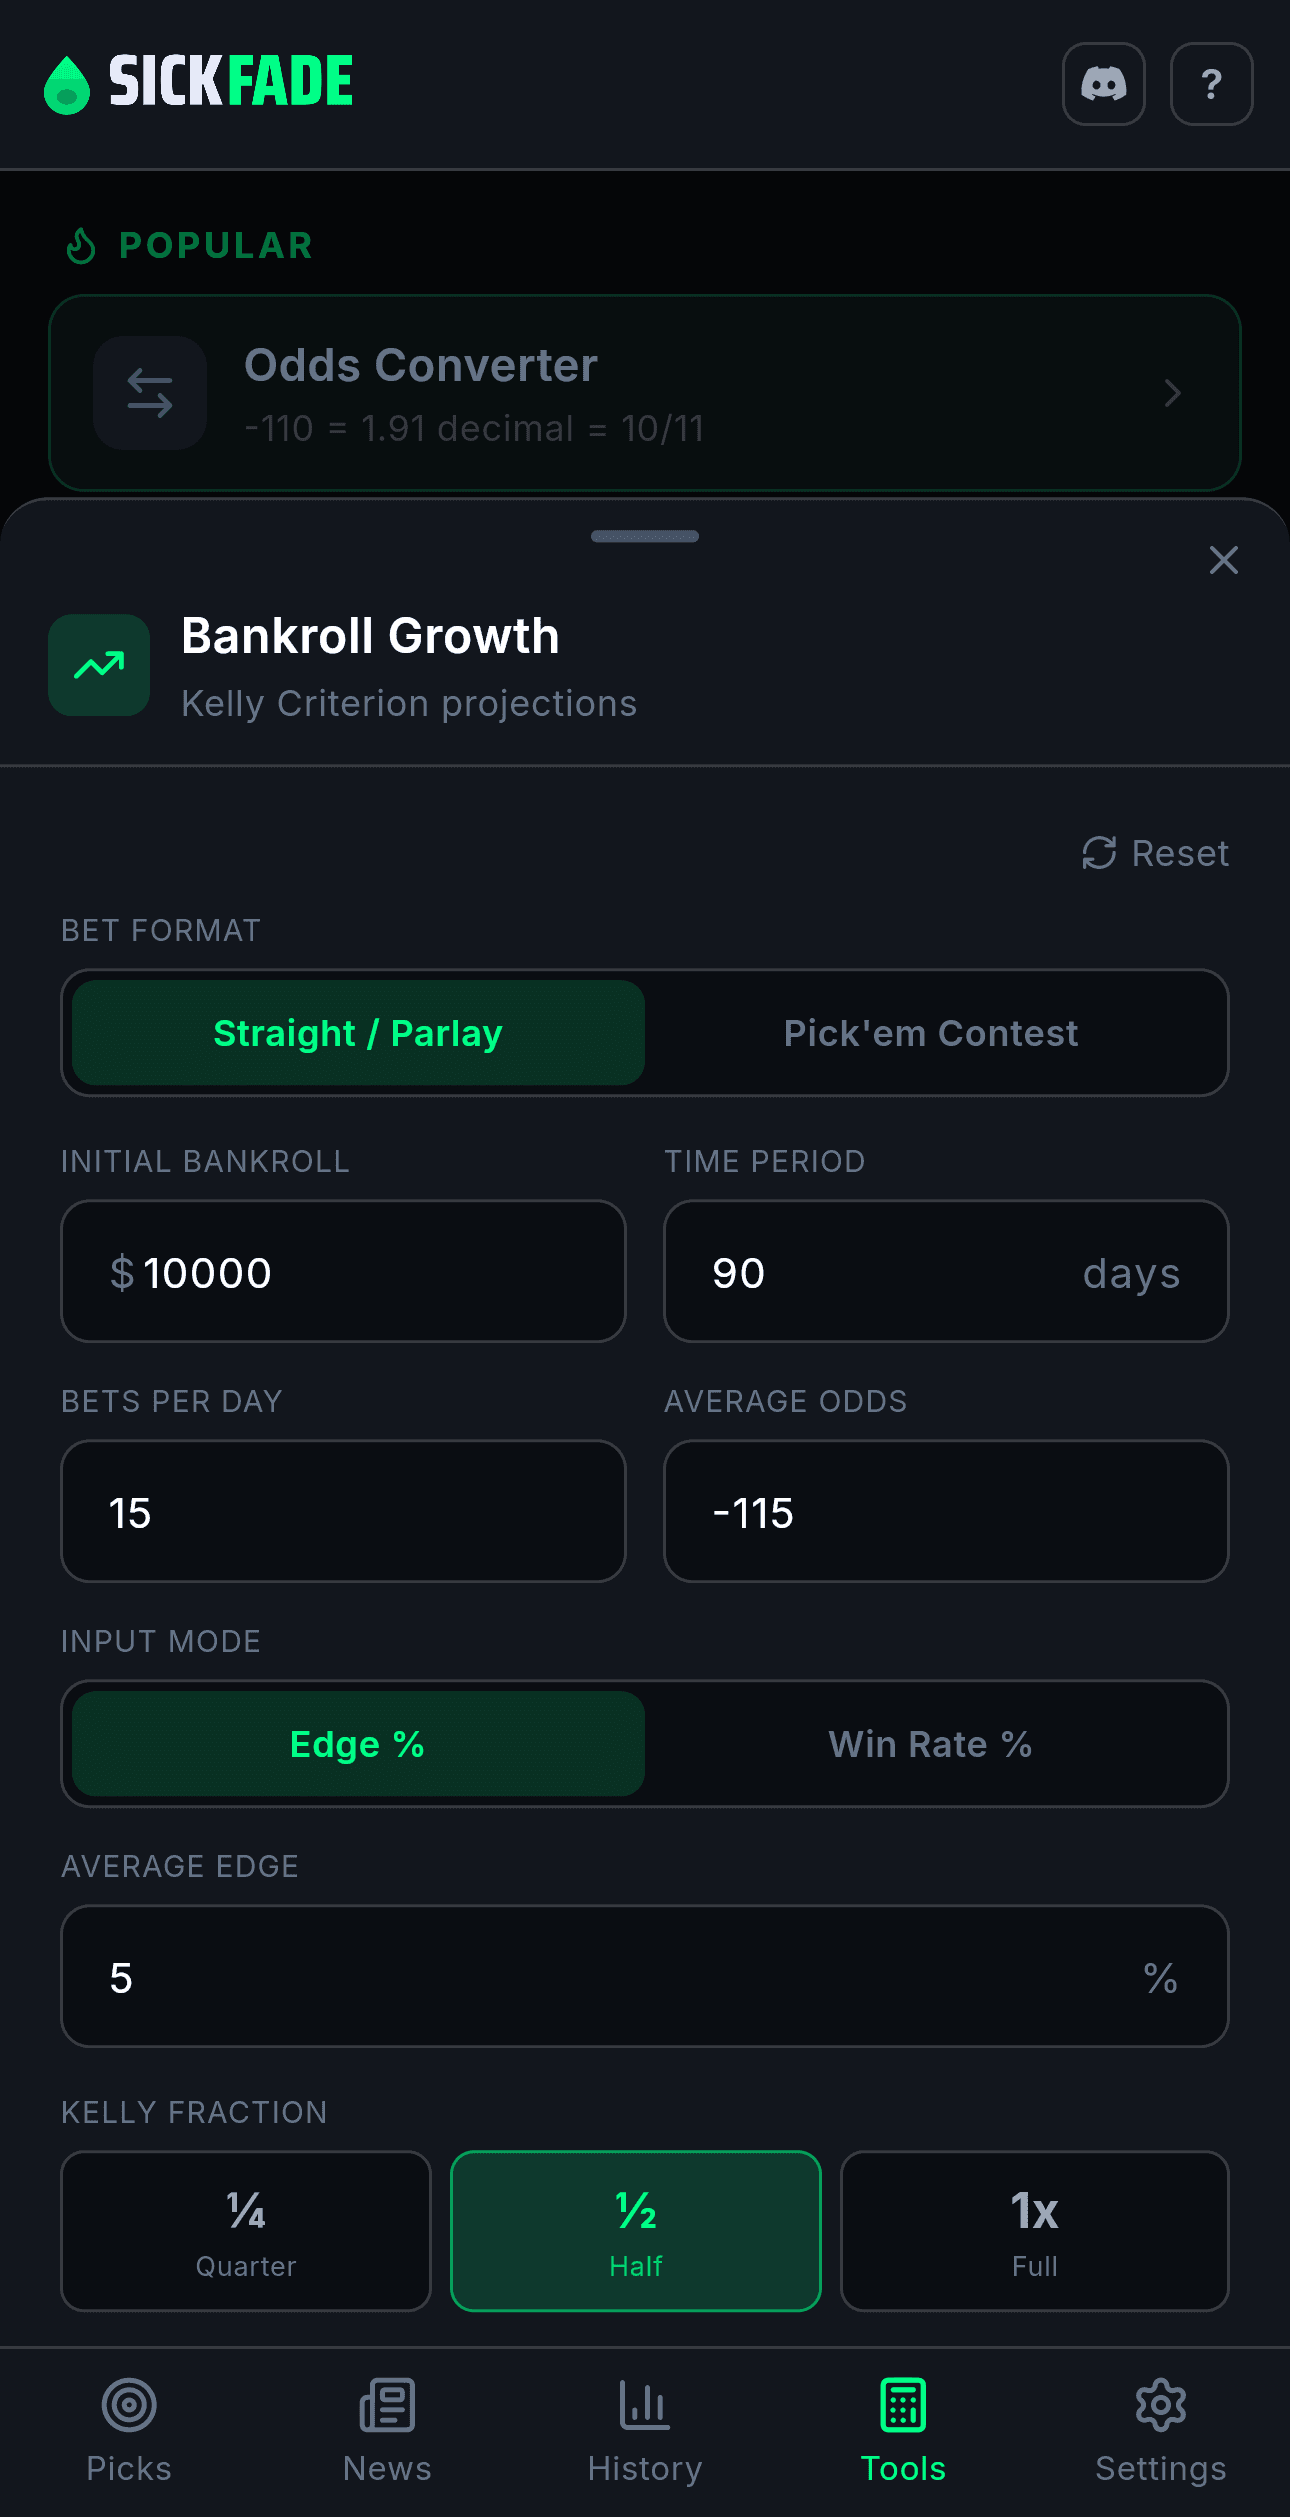
Kelly-based sizing and unit tracking so a real edge survives variance. The discipline layer that keeps you from over-committing, not a growth projection.
Two fair prices, then the edge
No black box. SickFade prices every market two ways and ranks the gap to the best available market. You can check the market math yourself in the devig calculator.
Devig the markets to a fair price
- No-vig consensus. Strip the vig from 20+ markets and weight the sharpest to one fair market probability.
- Bias-adjusted. Markets lean (the higher side gets bid up). We correct the higher/lower skew instead of splitting the vig evenly, so the fair number is honest.
Project the player from scratch
- AI-built stat models. Our own models project each player from the box score up, a fair number that does not depend on the market.
- Full distribution. Every number gets a modeled probability, so you can price any alt number off one input.
Where the best available market price beats both fair numbers. SickFade ranks that gap, so you take the biggest edge, not the loudest noise.
Beat the close, or it does not count
Closing-line value is the honest metric: did your price beat where the market closed. The figures and rows below are an illustrative sample of the format. See the full, live record on the results page.
| Date | Selection | Book | Posted | Close | CLV | Result |
|---|---|---|---|---|---|---|
| Jun 19 | Haliburton o9.5 Ast | FanDuel | +100 | -122 | +4.4% | Win |
| Jun 19 | Judge o1.5 TB | DraftKings | -104 | -118 | +2.8% | Loss |
| Jun 18 | Matthews o3.5 SOG | BetMGM | -115 | -138 | +3.1% | Win |
| Jun 18 | Edwards u27.5 Pts | Caesars | -108 | -104 | -0.7% | Loss |
| Jun 17 | Strider o6.5 K | FanDuel | +118 | +100 | +3.6% | Win |
| Jun 17 | Tatum o7.5 Ast | BetRivers | -120 | -120 | 0.0% | Push |
Illustrative sample, not live data. Every graded pick is kept, win or loss. See the full record.
Price the market yourself. Take the best number.
Free odds screen and devig calculator to start. The scanner, arbs, and middles when you want the full feed.